

The Sales Leader’s Guide to Mastering Sales Scorecard: Build, Track and Boost Sales Performance in 3 Steps
A salesperson scorecard is a formal document that tracks a salesperson's performance against key metrics that includes both activity levels and sales results.

On this page
Imagine you're a sales manager trying to track your team's performance. You have multiple reps, different targets, and endless data points. How do you know who's excelling and who needs support? This is where a sales scorecard becomes your secret weapon.
A well-structured sales team scorecard helps you measure success, hold reps accountable, and fine-tune your sales process. It highlights top performers, encourages healthy competition, and ensures your team stays on track.
In this guide, we’ll break down everything you need to know about sales scorecards—what they are, why they matter, and how to create one. Plus, we’ll share tips and sales rep scorecard examples to help you get started.
What is a salesperson scorecard?
A salesperson scorecard refers to a tool, which is a formal system that allows the sales force to measure and track the performance of sales representatives within an organization.
It provides a structured way to evaluate key metrics and objectives that are critical to the success of the sales team. With a scorecard, a salesperson can check at a glance:
- The total amount of revenue generated by the salesperson is often measured on a monthly or quarterly basis.
- The percentage of the sales quota or target that the salesperson has achieved.
- The number of new customers or accounts that the salesperson has successfully onboarded.
- Percentage of existing customers that the salesperson has retained over a specific period.
- An average monetary value of the deals or sales closed by the salesperson.
A scorecard also allows the salesperson to track their performance by understanding their strengths, and weaknesses. Performance-based aspects that a sales rep can track include:
- Number of qualified leads or opportunities one has generated through various prospecting activities.
- The percentage of sales opportunities that the salesperson has successfully converted into closed deals.
- Customer satisfaction level
- The opportunity to upsell and cross-sell.
This information can then be used to identify areas for improvement, provide targeted coaching and training, and ultimately drive better sales performance and business outcomes. Take reference from Bain & Company.
Bain & Company's client, an IT giant worldwide experienced rapid revenue growth. However, their sales and marketing costs were increasing even faster than their sales. So, they investigated how this money was being spent, and examined both the sales team itself, and their scorecard to understand the area of improvement, and the processes that prepare them for customer interactions.
One challenge was that salespeople had difficulty obtaining the necessary training and information on new products when they were launched. This lack of knowledge impacted their ability to effectively sell these products. This contributed to salespeople spending less than 25% of their time directly interacting with customers. As a result, it significantly reduced overall sales productivity.
So Bain & Co,. analyzed and pinpointed the most effective sales enablement practices that directly addressed their client's specific challenges. This involved examining both internal practices, including maintaining their advancement, and shortcomings.
To achieve a swift increase in productivity, Bain & Company advises their client to have a more disciplined culture based on training. Their client invested in comprehensive training programs for sales reps that had the potential for improvement.
They also advised revamping their sales model, in accordance with sales and incentives around next-gen products. So, instead of relying on hundreds of scattered portals, create a single, centralized online workspace for sellers to access all necessary information efficiently.
They also shared that their clients should move beyond static sales materials. So, they need to implement interactive sales tools that encourage feedback from both sellers and customers for more effective communication and presentations.
As a result,
- The client's customer-facing selling time rose by 33%, and time to revenue improved.
- Their overall costs decreased by 10% and they saved over $25 million in non-sales and marketing expenses.
- Partnering strategy changes led to over $20 million in actual savings and the potential for $250 million in additional bookings.
This case study demonstrates the value of analyzing individual sales representative performance data across all teams. By doing so, Bain & Company was able to develop a strategy that showed significant benefits.
The strategy not only increased the client's revenue by $250 million in additional bookings but also provided sales representatives with the opportunity to improve their skills through targeted training.
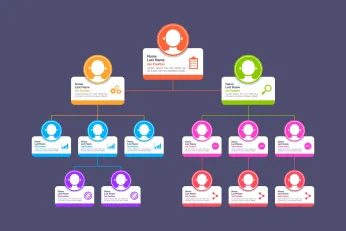
Difference between sales scorecard and sales dashboard
Both sales scorecards and sales dashboards are valuable tools for managing sales performance, but they serve different purposes. A sales dashboard is a visual representation of key sales metrics, providing a real-time snapshot of activity and performance. It's like a central hub that displays important data points, allowing for quick monitoring of progress.
Whereas a sales scorecard goes beyond just displaying data. It tracks progress toward specific goals and objectives. Think of it as a performance report card that compares current performance against established targets. It helps assess how well the sales team is on track to achieving its goals.
But the Compass scoreboard has a different function altogether. Scoreboard is used for gamification purposes to help companies transform their sales activities into an engaging, revenue-boosting adventure. It would display real-time leaderboards and detailed scorecards for sales reps.
Moreover, the scoreboard would allow the sales reps to see how they are performing compared to their peers, which helps drive higher sales productivity and motivation.
You can get a real-time view of their performance metrics, commission earnings, and goal progress, and incorporate gamified commission strategies.
Salesperson scorecard examples
Want to know what a great sales scorecard looks like? Seeing real examples makes it easier to understand how they work. Let’s explore a few sales scorecard examples that help track performance, boost motivation, and drive results.
1. Individual sales rep scorecard
This sales rep scorecard focuses on an individual’s monthly performance. Created by Slide Team, it tracks key sales scorecard metrics like:
- The average number of calls made per hour
- Response time to leads
- Performance benchmarks and targets
With this scorecard, a salesperson can see what’s working and where they need improvement. It helps them stay on track and make better sales decisions.
2. SaaS sales team scorecard
For a broader view, a sales team scorecard helps compare multiple reps’ performances. This sales enablement scorecard highlights key metrics like:
- The number of demo calls completed
- New customer acquisitions (logos won)
Sales leaders can use this sales rep performance scorecard to measure productivity, encourage friendly competition, and set clear goals.
Using a well-structured sales rep scorecard keeps performance transparent and measurable.
Now that we have discovered the two types of sales rep scorecard utilization, let’s learn how to build.
How to build a sales scorecard?
Follow this guide to build a sales scorecard that works for your team.
Step 1: Choose the right metrics
A good sales scorecard starts with the right metrics. These should be meaningful, actionable, and directly linked to success. Avoid tracking administrative tasks like updating a CRM. Instead, focus on activities that drive results, such as:
- Qualified leads generated
- Outbound calls made
- Proposals sent
- Sales meetings scheduled
- Deals won vs. lost
Before finalizing metrics, check your current sales KPIs. Identify which activities boost your win rate. For example, if face-to-face meetings improve closing rates by 30%, include them in your sales scorecard.
Ask yourself:
- Are reps hitting their targets?
- Is our team improving performance?
- How do top performers close sales?
- Are we generating and qualifying enough leads?
Choose three leading indicators (like calls or meetings) and one lagging indicator (like deals closed) to ensure a balanced sales scorecard.
Step 2: Set clear goals
Once you've selected metrics, set realistic goals. Use existing data to work backward from revenue targets. For example:
- Goal: $10 million per quarter
- Average deal size: $1 million
- Deals needed: 10
- If 25% of proposals convert to sales, 40 proposals are required
- If 1 in 5 prospects reaches the proposal stage, 200 prospects are needed
- If 10 calls lead to one meeting, 2,000 calls are required
Now, distribute these goals across the team. If 10 reps share the workload, each must make 200 calls per quarter. Managers should track these numbers on their sales team scorecard.
Step 3: Assign wights to metrics
Not all activities carry the same importance. Prioritize actions that directly impact revenue. Assign weights based on impact:
- Deals reaching proposal stage = highest weight
- Demos (leading to proposals) = medium weight
- Outbound calls (leading to demos) = lowest weight
This approach ensures reps focus on high-value tasks rather than just hitting activity numbers.
Take this chai-led beverage platform as an example.
For instance, consider the world’s largest Chai-led beverage platform's integration of Compass. This integration streamlined the analysis of the sales team's performance.
This famous beverage platform is the world's leading platform focused on Chai beverages. It operates across various channels and reaches millions of customers daily. These channels include retail stores, delivery kitchens, and partnerships with corporate offices and institutions.
However, they faced challenges because their incentive programs were complex and relied on manual tracking of beverages. Different incentives were offered to their sales team for installing machines and to distributors for machine deployment and product consumption.
Further complicating things, factors like security deposits, monthly fees, store closures, and contracts also affected the final payouts.
Unfortunately, neither managers nor salespeople had clear visibility into sales performance. Incentive calculations lacked transparency, and payouts were delayed due to manual tracking, the involvement of multiple teams, and the absence of real-time data. To address these issues, the company sought a user-friendly solution for managing sales performance.
They integrated Compass:
To improve their sales management system, this beverage company integrated Compass. The beverage-led platform had a simplified setup for commission calculations and performance management.
It also gained increased transparency into the sales team's performance through the Compass salesperson scorecard and provided end-users with clear visibility into their sales commissions. As a result,
- This chai-led beverage company successfully motivated the BD and distributors to perform better with sales commission transparency.
- Commissions paid out to BDs and distributors saw a 200% increase.
- Consumption revenue grew by an average of 4% each quarter.
- Machine deployments increased by 40% within just 6 months.
- The number of individuals qualifying for commission incentives grew by 115% in the past 6 months.
Best practices based on industry-leading organizations to create salesperson scorecards:
The above-mentioned case studies from Bain & Company, and the leading chai-led beverage platform highlight several best practices for managing sales performance through technology integration. To ensure that you implement a winning scorecard, maintain:
- A streamlined incentive programmer: Similar to the beverage platform, simplify your previously complex incentive structure. The chai-led beverage company integrated Compass which made it easier for both managers and salespeople to understand commission calculations.
- Improved sales visibility: Always have full visibility of the performance of each sales rep. Compass's salesperson scorecard provided the beverage-led industry with real-time data on performance. This gave managers and salespeople clear visibility into sales activity and progress toward goals.
- Transparency and efficiency: Eliminate the manual tracking and delays in payouts to increase transparency in the incentive process.
- Increased motivation of the sales reps: Clearer visibility into commissions and timely payouts likely motivate the sales team to perform better. Compass provided simplicity with tracking abilities and Bain & Company advised their clients to set up a targeted training method to increase participation and motivation.
- Make data-driven decisions: Sales CRM systems provide valuable insights to guide strategic decision-making. Always ensure that your team has access to analytics capabilities. Sales reps can gain valuable insights to guide strategic decision-making. A salesperson scorecard can help representatives monitor employee and team performance, as well as project profitability.
- Measuring the performance, the right: One thing all the companies, namely the beverage-led platform, and Bain & Company had in common was that they all wanted to measure the performance of their salesperson. KPIs specific to sales representatives and project milestones help organizations monitor employee and team performance. This data-driven approach allows for continuous improvement and course correction as needed.
Following the recommended best practices will help you ensure that your salesperson scorecard remains effective and accurate.
Maximize productivity of your sales team with sales rep scorecard
By integrating a salesperson scorecard, you can get a clear picture of how your team is doing against set goals and objectives. This allows you to not only identify areas of strength and weakness but also make informed decisions about sales strategies by analyzing data from the scorecard.
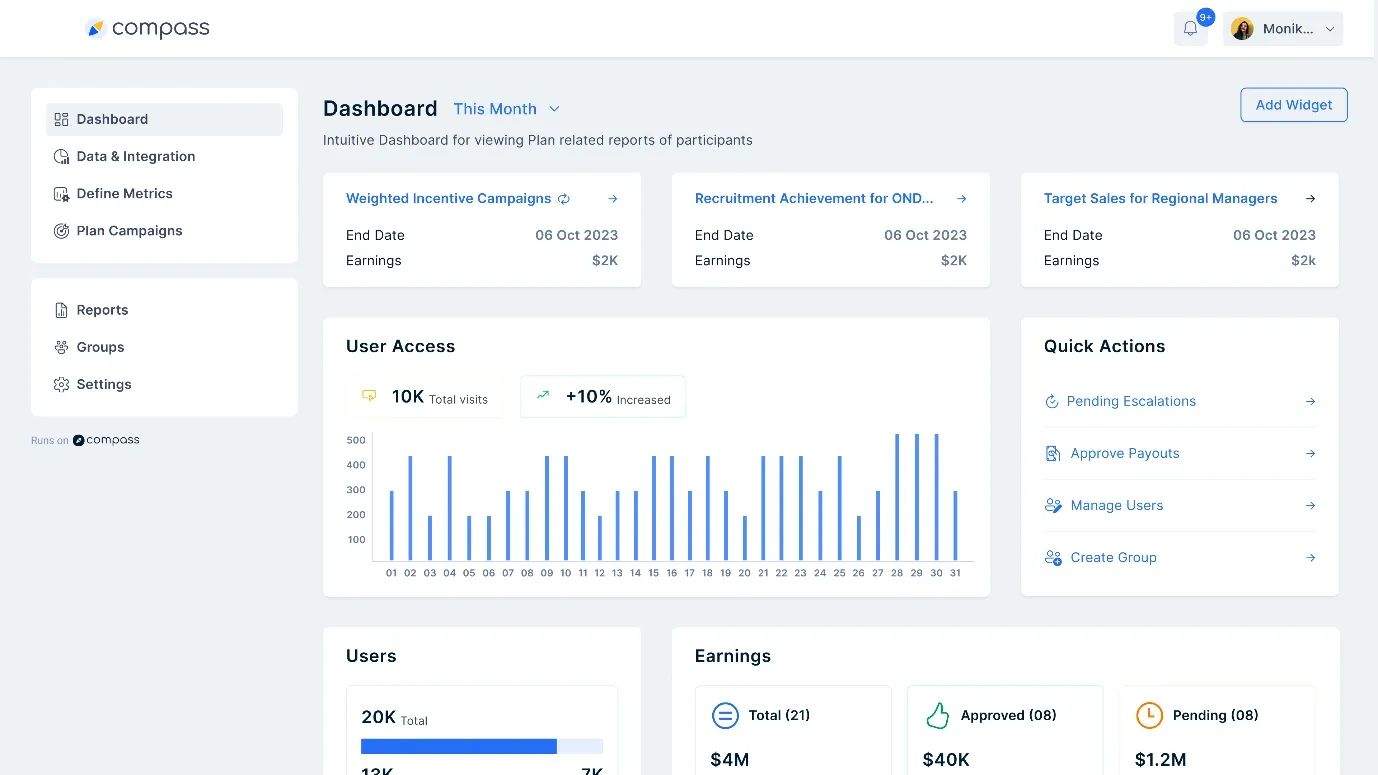
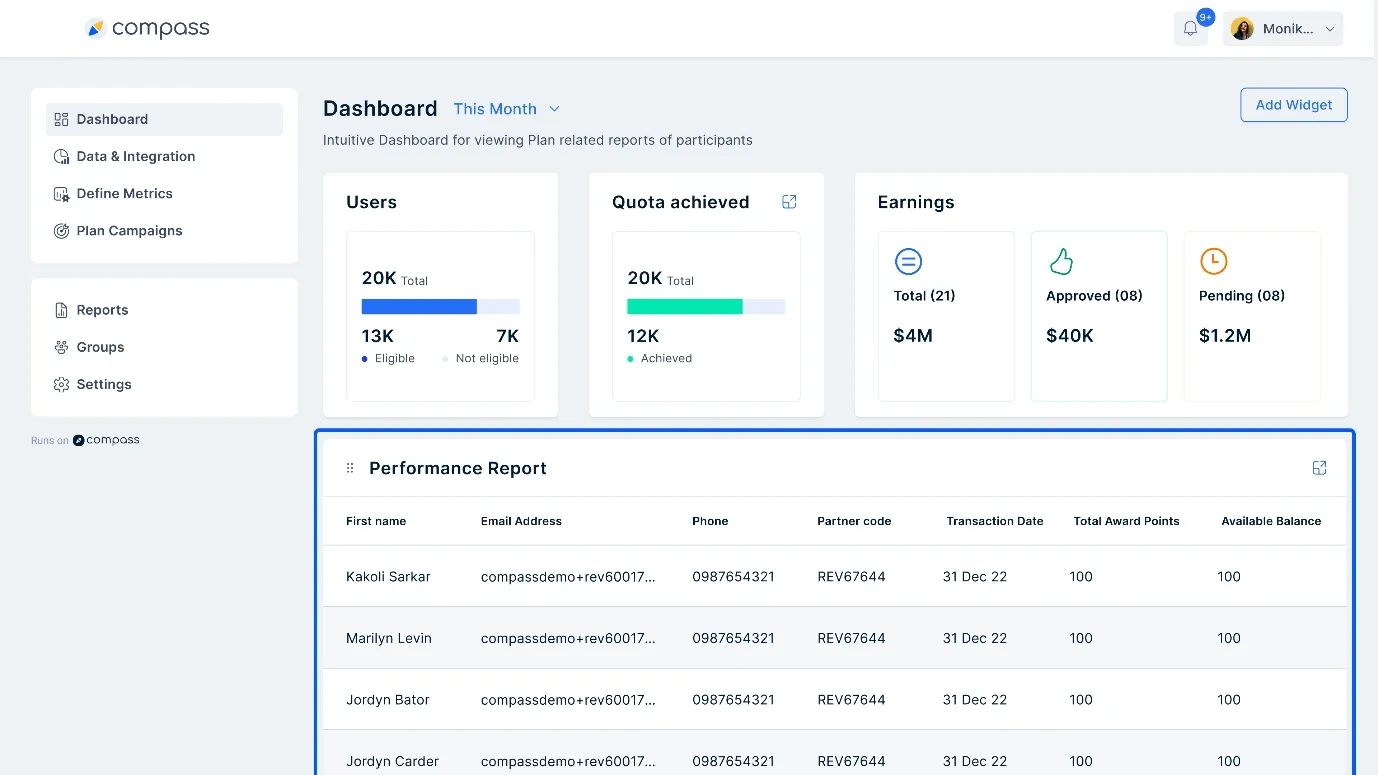
We recommend Compass. Compass helps sales teams track individual and team performance through detailed scorecards. With the solution, you can:
- Get real-time visibility into sales rep performance.
- Monitor achievements and motivate the team.
- Access live leaderboards that show how each salesperson is performing compared to their peers.
- Access a user-level custom view for each sales rep to track their own commission earnings and progress towards goals.
Schedule a demo call with our specialists to know how our solution can be the answer to your issues.
FAQs
1. What is the difference between KPI and scorecard?
A KPI (Key Performance Indicator) is a specific, measurable metric that focuses on individual aspects of performance, providing a narrow, detailed view. A scorecard is a performance management tool that businesses use to track and improve performance by aligning activities with strategic objectives. Scorecards can incorporate multiple KPIs to provide a broad overview of performance.
2. What is a predictive sales scorecard?
A predictive sales scorecard is a tool that helps sales teams forecast future performance based on historical data, trends, and key sales scorecard metrics. Unlike a traditional sales rep scorecard, which measures past performance, a predictive sales scorecard uses AI, machine learning, and data analytics to anticipate outcomes and guide decision-making.
3. What are the two different types of scorecards?
The search results mention KPI scorecards and balanced scorecards as two types of scorecards. KPI scorecards focus on key performance indicators to track and improve a business's performance1. Balanced scorecards use a mix of financial and non-financial measures across different perspectives to guide strategy.