


Nesta página
Ter uma visão clara e dinâmica do seu desempenho de vendas na ponta dos dedos através de um software de painel de vendas pode ser crucial para o sucesso das vendas. Visualizar e analisar as principais métricas de vendas num local centralizado através de uma plataforma de fácil utilização não só transformará a forma como o processo de vendas ocorre, como também transformará os dados brutos em informações acionáveis e dará aos representantes uma visão clara do desempenho das vendas.
Tomemos como exemplo a Ford Motors. A Ford1tinha diferentes departamentos com dados de clientes separados, o que dificultava a compreensão das necessidades dos clientes. Assim, em 2022, a Ford reorganizou a empresa e estabeleceu unidades de negócios separadas para gerenciar diferentes áreas. No entanto, criaram uma unidade dedicada, a Ford Pro, para atender a clientes comerciais e governamentais. Mas para garantir que essa reestruturação fosse bem-sucedida, a Ford teve que melhorar a unidade interna.
Esta falta de uma base de dados de clientes centralizada e partilhada prejudicava a capacidade da Ford de construir relações fortes e duradouras com os clientes. A Ford passou quatro meses implementando um novo sistema, o Salesforce Platform, que vem com um software de painel analítico de vendas integrado para centralizar todos os dados de seus clientes.
Criaram um painel de controlo utilizando o CRM Analytics para acompanhar o bom funcionamento da transformação, analisando áreas como a interação com o cliente, a redução de chamadas desnecessárias e a gestão de campanhas de marketing. Em pouco tempo, a Ford notou que as taxas de cliques por correio eletrónico aumentaram 48% e que estão a ser necessários menos quatro dias para manter as campanhas.Este resultado pode ser alcançado com a ajuda doCompass. Trata-se de um software de gestão de incentivos às vendas que permite às empresas motivar as suas equipas de vendas através de um painel de controlo automatizado que dá visibilidade em tempo real do desempenho e das informações sobre as comissões.
Este facto realça a importância do software de painel de controlo de vendas e a forma como uma organização, em qualquer escala, necessita de um painel para isolar eficazmente o pipeline de vendas. Este blogue irá explorar as razões pelas quais os painéis de análise de vendas são essenciais e como podem ajudá-lo a conduzir a sua empresa ao sucesso.
O que é um software de painel de controlo de vendas?
Para compreender o software de painel de controlo de vendas, temos de compreender o que significa painel de controlo de vendas. Refere-se a uma representação visual das métricas de vendas para que a força de vendas possa aceder aos dados relacionados com o progresso dos objectivos de vendas.
A representação visual pode ser feita sob a forma de um gráfico ou de uma tabela que pode facilmente revelar onde as equipas de vendas estão a ter um bom desempenho e onde precisam de melhorar.De acordo com aSalesforceum CRM optimizado com um painel analítico de vendas integrado pode trazer-lhe mais 44% de oportunidades e um aumento de 37% nas receitas de vendas.
No entanto, o software de painel de controlo de vendas é uma ferramenta que organiza e apresenta visualmente os dados de vendas. Pode integrar a ferramenta no seu CRM, para melhorar a eficiência. Permite aos utilizadores compreender e analisar rapidamente métricas de vendas importantes. Se for integrado e utilizado da forma correta, este software pode:
- Melhorar a visibilidade. Pode aceder a uma visão clara e concisa das principais métricas de vendas.
- Ajuda-o a tomar decisões baseadas em dados. Um software de painel de controlo de vendas pode permitir que os gestores tomem decisões baseadas em dados para melhorar as estratégias de vendas.
- Simplificar o desempenho das vendas. Os painéis de análise de vendas simplificam o processo de acompanhamento do desempenho individual e da equipa e permitem uma melhor orientação e definição de objectivos.
- Aumentar a eficiência dos representantes que o utilizam. Os painéis de controlo automatizam a recolha de dados e a elaboração de relatórios. Poupa tempo e reduz o risco de erros.
- Por último, aumentar o desempenho das vendas. As informações dos dados dos painéis de controlo podem ser utilizadas para identificar áreas a melhorar e otimizar as actividades de vendas para obter melhores resultados.
De acordo com o relatório de tendências de vendas para 2024 da HubSpotRelatório de tendências de vendas para 2024 da HubSpotas ferramentas de gerenciamento de vendas e as ferramentas de produtividade de vendas têm o ROI mais alto, com 27% e 25%, respetivamente.
Os números demonstram ainda mais o valor da integração do software de painel de controlo de vendas. Esse software tem o potencial de acelerar significativamente o processo de vendas para os representantes de vendas individuais. Vamos aprofundar as razões pelas quais a equipa de vendas necessita deste software a um nível mais detalhado.
O que faz um ótimo painel de vendas?
Um bom painel de vendas deve ser fácil de utilizar e fornecer informações valiosas. Para criar um painel de controlo eficaz, concentre-se no seu público e escolha os KPIs de vendas certos. Faça a si próprio estas perguntas antes de começar:
1. Quem é o seu público?
Identifique quem irá utilizar o painel de controlo. Destina-se a um executivo de vendas, gestor ou vendedor? Compreender o seu público ajuda-o a decidir quais os KPIs de vendas a incluir.
2. Em que KPIs de vendas se deve concentrar?
Um ótimo painel de compensação de vendas deve destacar as principais métricas. Concentre-se em dados importantes como previsões trimestrais, cumprimento de quotas e crescimento de receitas. Evite sobrecarregar o painel com demasiadas métricas, pois isso pode torná-lo confuso.
3. O seu painel de controlo está ligado a dados em tempo real?
Certifique-se de que o painel de controlo obtém dados de uma fonte fiável gerida pela sua equipa de análise de vendas. Além disso, decida com que frequência deve ser atualizado para fornecer informações precisas.
4. Como vai partilhar o painel de controlo?
Decida como as pessoas vão aceder ao painel de controlo. Podem subscrever actualizações regulares? Estará disponível num CRM ou num portal interno?
Utilizar o melhor software de painel de controlo ajuda-o a criar relatórios de vendas eficazes. Uma ferramenta como o Tableau facilita a criação de um painel de controlo de vendas 360 que serve todas as equipas. Os utilizadores podem definir alertas automáticos para eventos importantes, como o cumprimento de quotas de vendas ou de objectivos de receitas. Um software de painel de vendas bem concebido mantém os líderes de vendas informados, permitindo-lhes concentrar-se nos objectivos gerais.
4 exemplos de painéis de controlo de vendas que tem de implementar
1. Painel de controlo do desempenho das vendas
Um painel de desempenho de vendas dá-lhe uma visão completa do envolvimento dos utilizadores, dos ganhos e das métricas gerais de vendas. Ajuda as equipas de vendas a acompanhar o seu progresso, a comparar previsões e a tomar decisões baseadas em dados. Compass, um software ICM com capacidades de tabela de classificação e scorecard, fornece estas informações para ajudar as empresas a otimizar as suas estratégias de vendas.
Widgets principais:
- Acesso do utilizador: Mostra quantos utilizadores visitaram a Web ou a aplicação móvel Compass num período de tempo específico. Isto ajuda a analisar o envolvimento e o alcance.
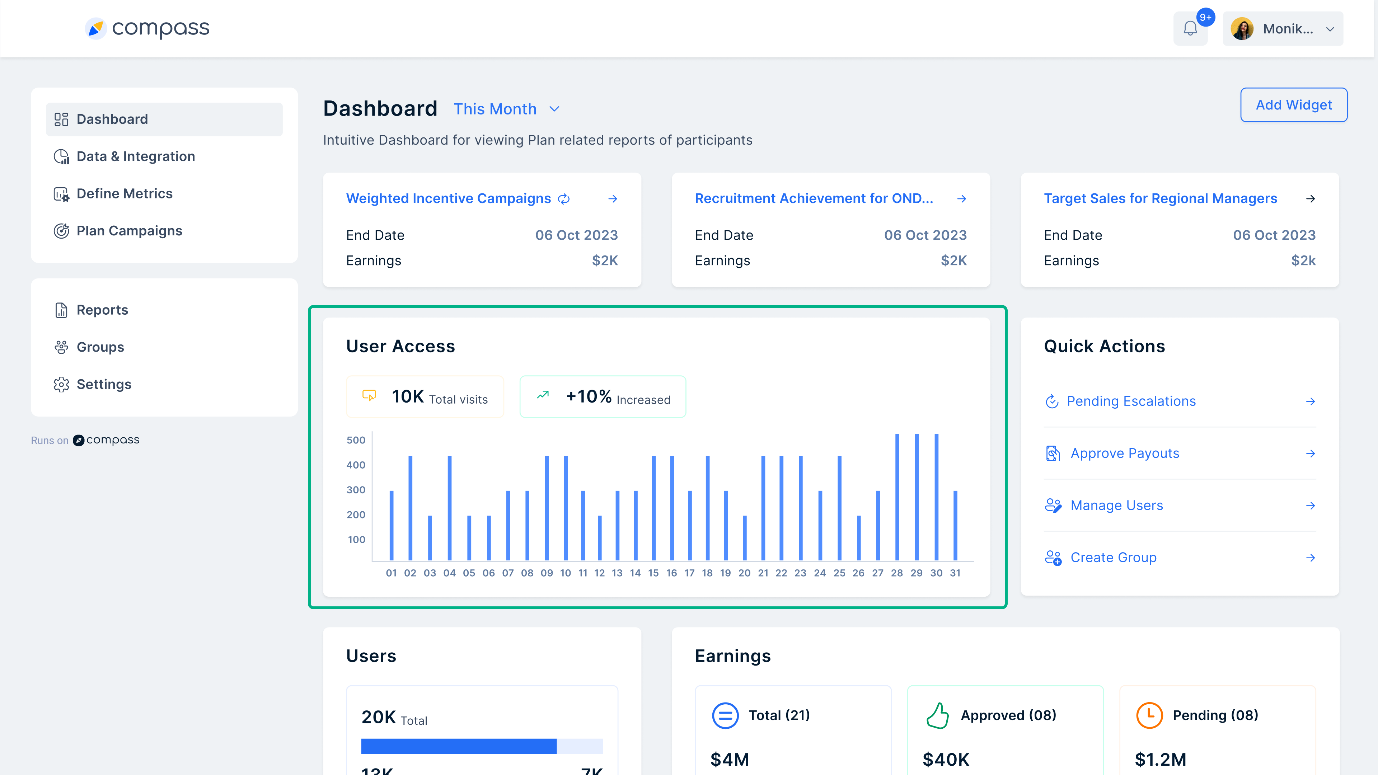
- Acções rápidas: Permite o acesso rápido a funcionalidades essenciais como pagamentos de aprovações, gestão de utilizadores e criação de grupos no Compass.
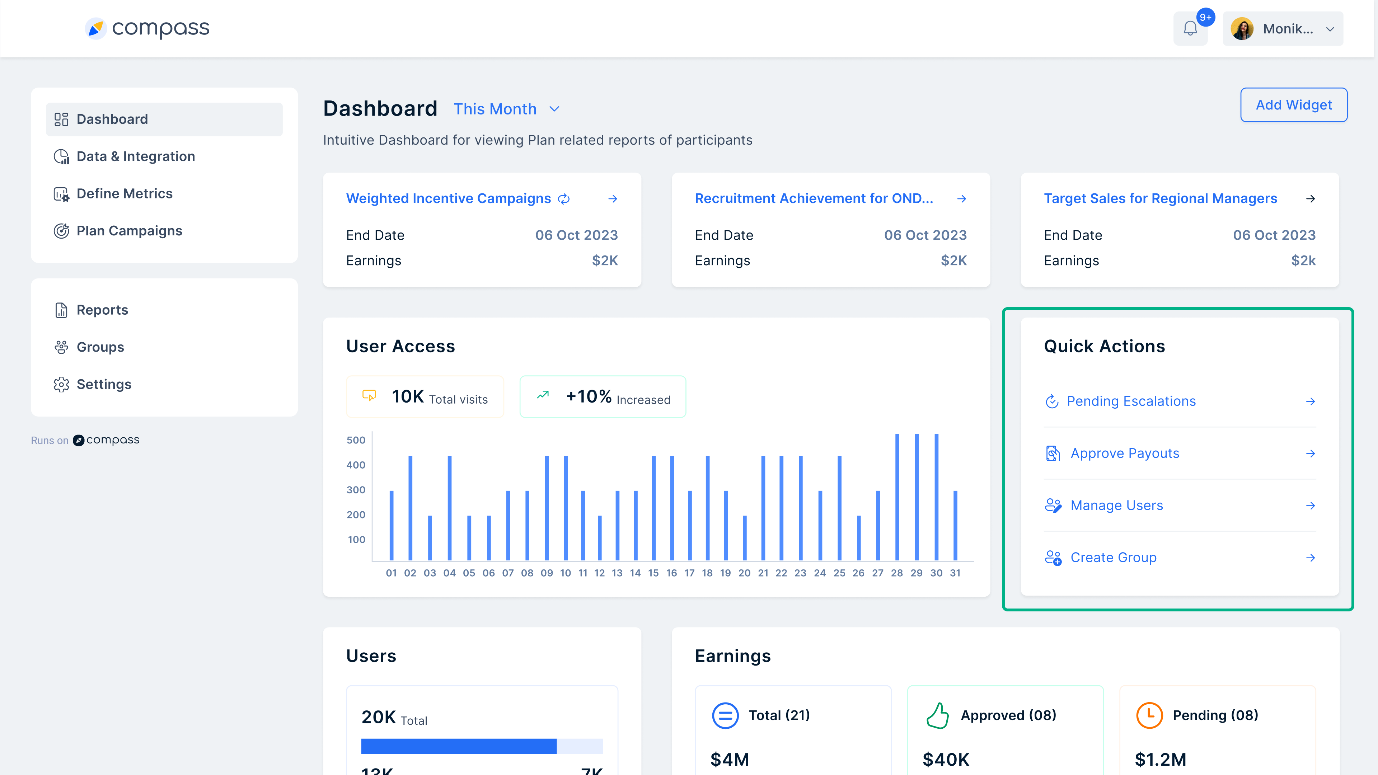
- Utilizadores e quota: Apresenta os utilizadores que atingiram marcos (Elegíveis) e os que não atingiram (Não Elegíveis). Além disso, mostra os detalhes do cumprimento da quota.
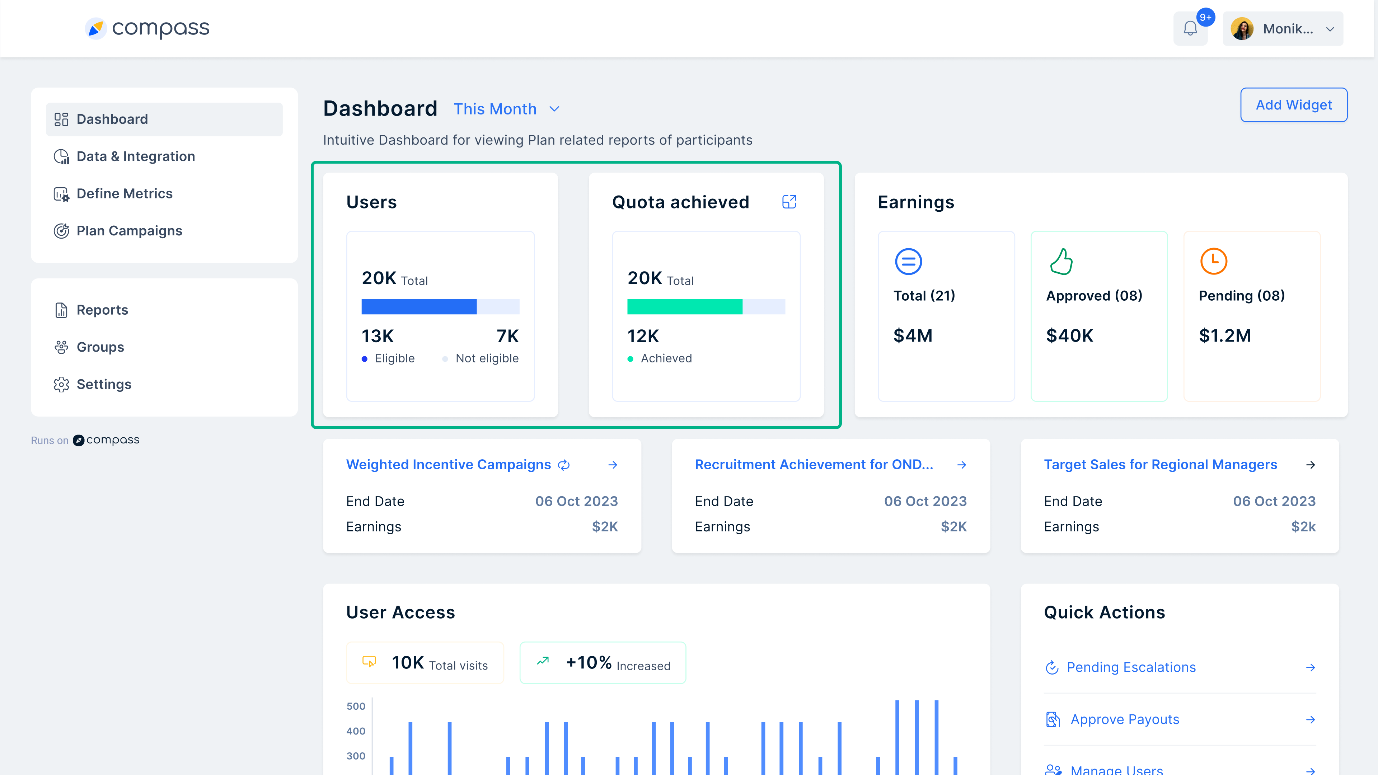
- Ganhos: Fornece um resumo do total de ganhos, aprovações pendentes e pagamentos rejeitados, garantindo transparência nas comissões.
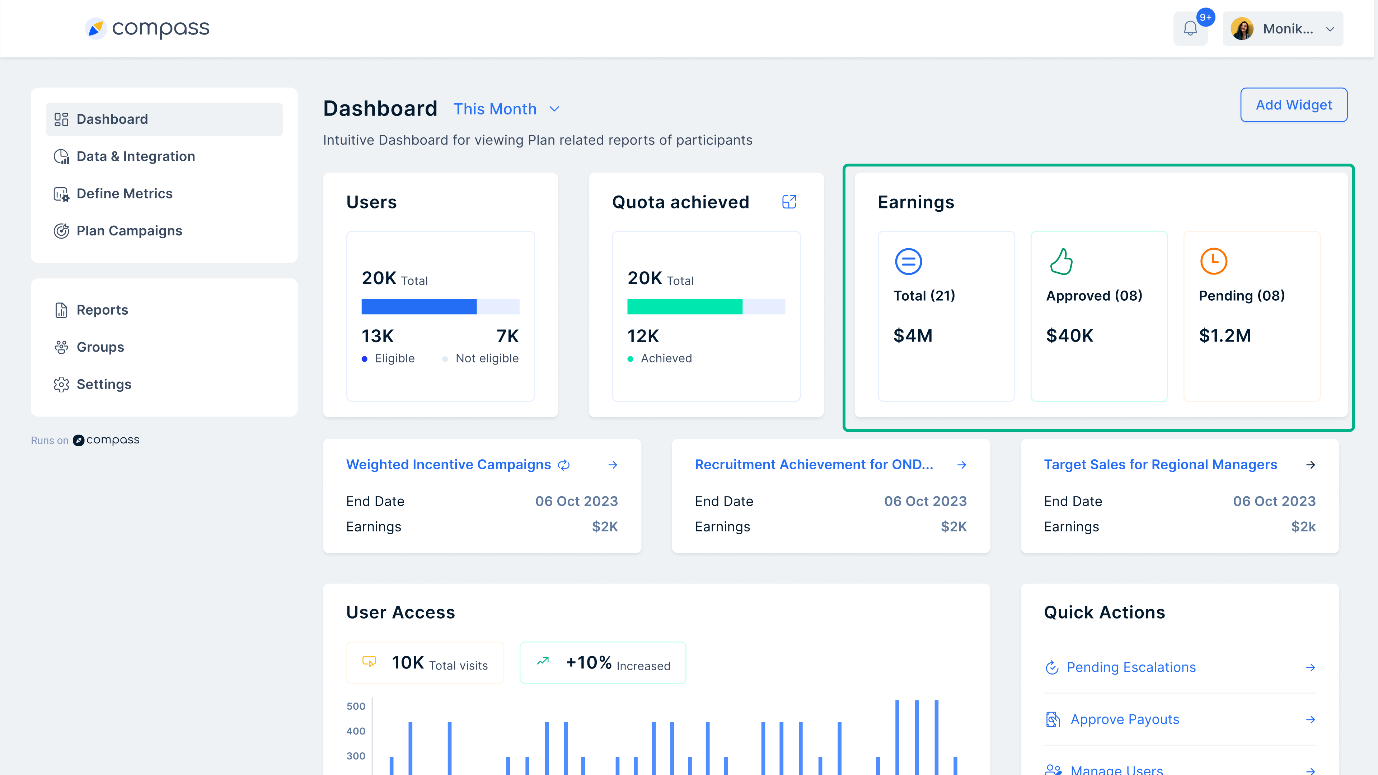
Ideal para: Analistas e gestores de vendas que necessitam de uma visão estruturada da atividade e dos ganhos dos utilizadores.
Quando utilizar: Ideal para acompanhar o desempenho diário ou semanal das vendas e tomar decisões informadas utilizando Compass.
2. Painel de controlo da compensação de vendas
Um painel de controlo da compensação de vendas ajuda as empresas a acompanhar a forma como as comissões e os incentivos são distribuídos. Ele garante pagamentos justos e transparentes. Compass simplifica este processo ao fornecer informações claras sobre as tendências de compensação.
Widgets principais:
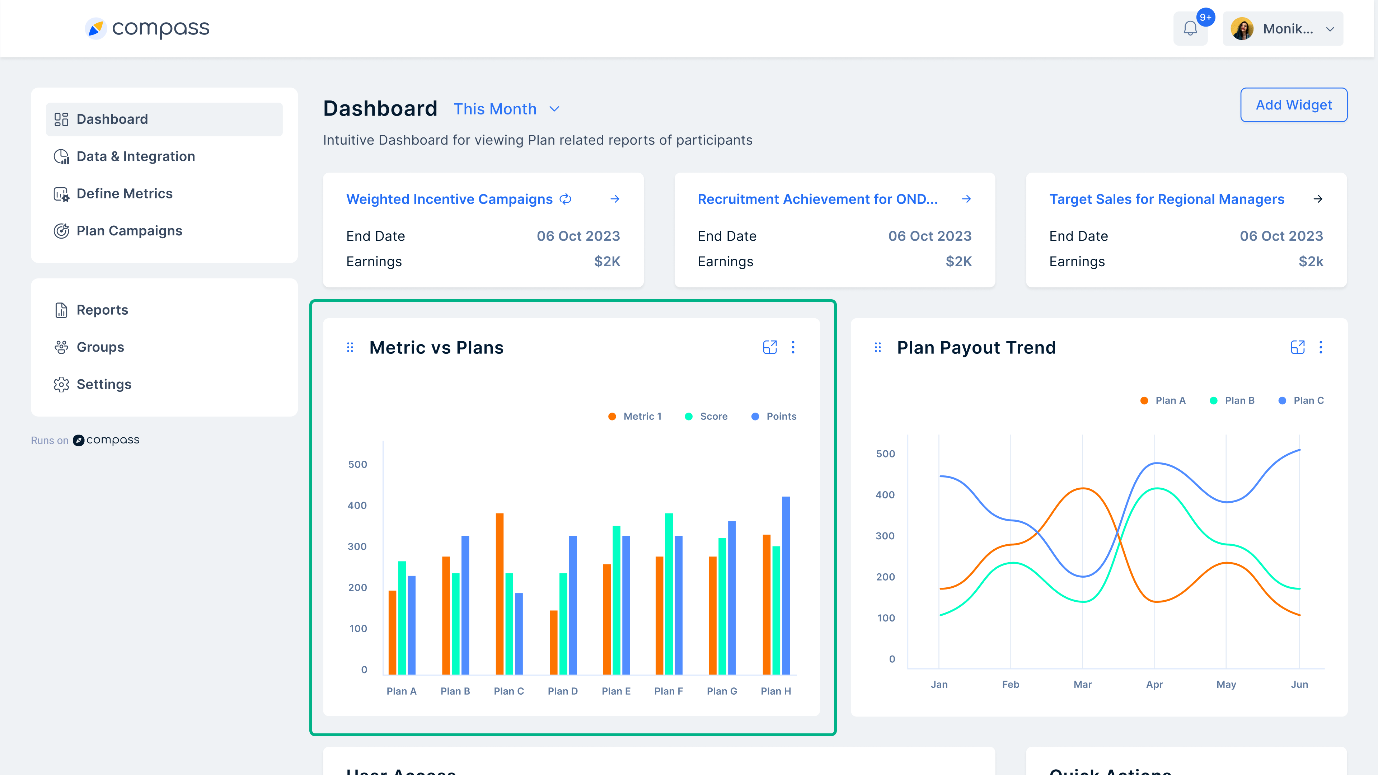
- Tendências de pagamento do plano: Ajuda a compreender como os utilizadores são pagos mensalmente, trimestralmente ou anualmente. Destaca quaisquer tendências invulgares nos pagamentos.
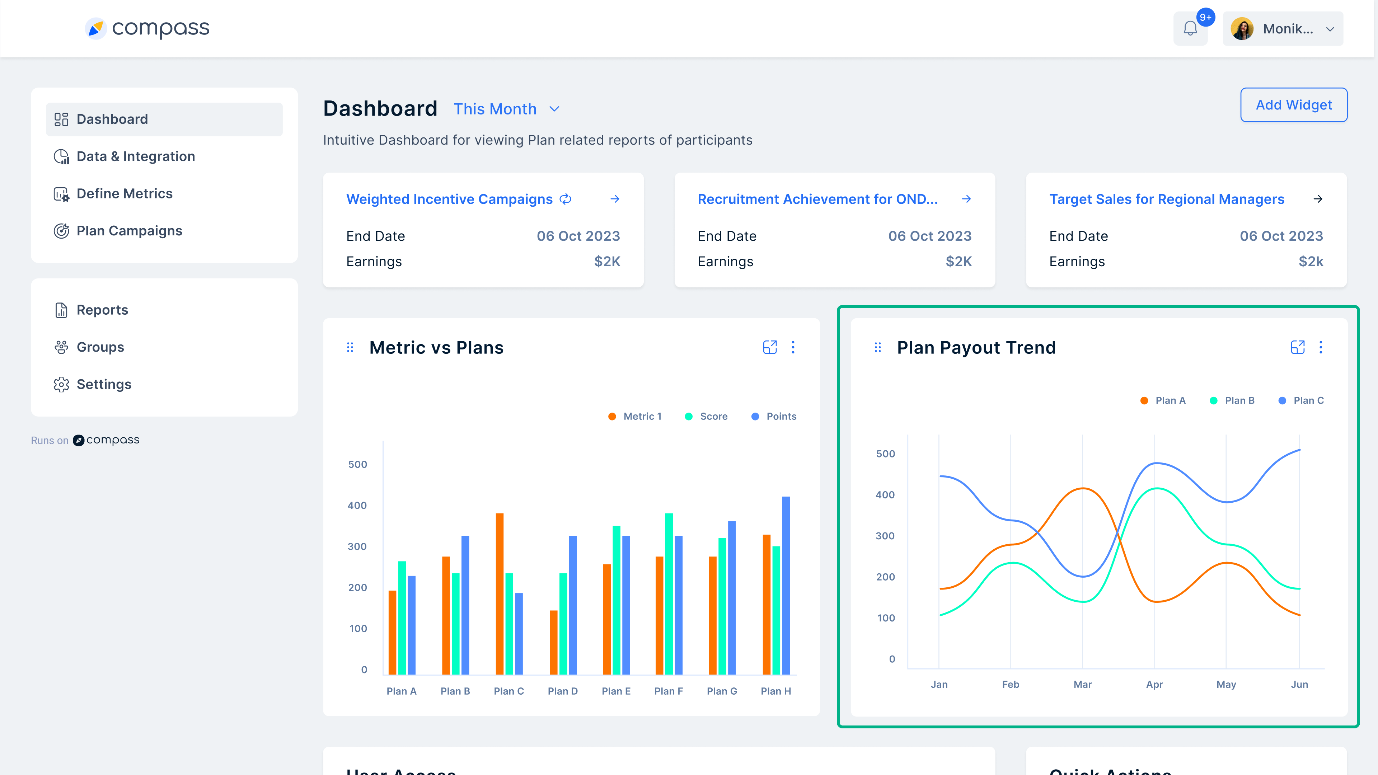
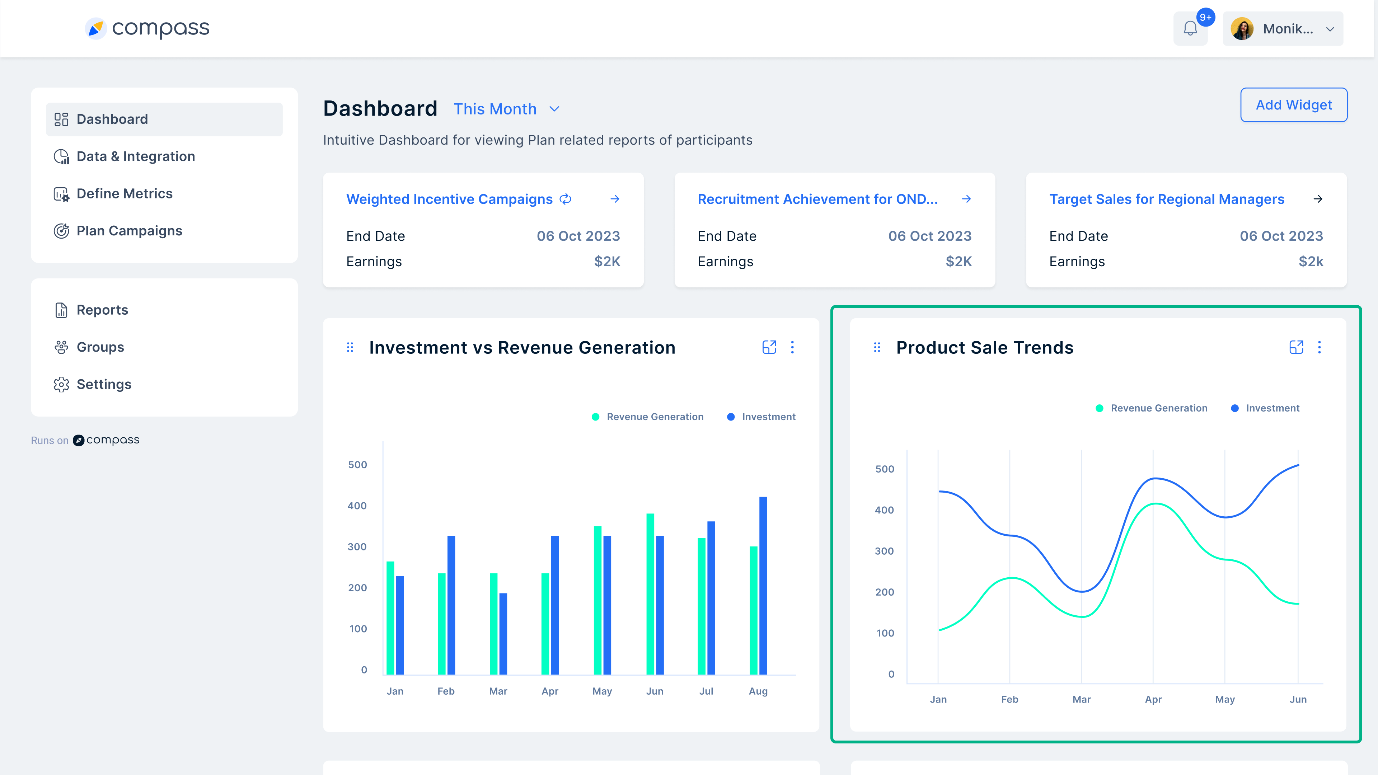
- Investimento versus geração de receitas: Compara os investimentos em incentivos com as receitas obtidas. Isto ajuda a avaliar o ROI.
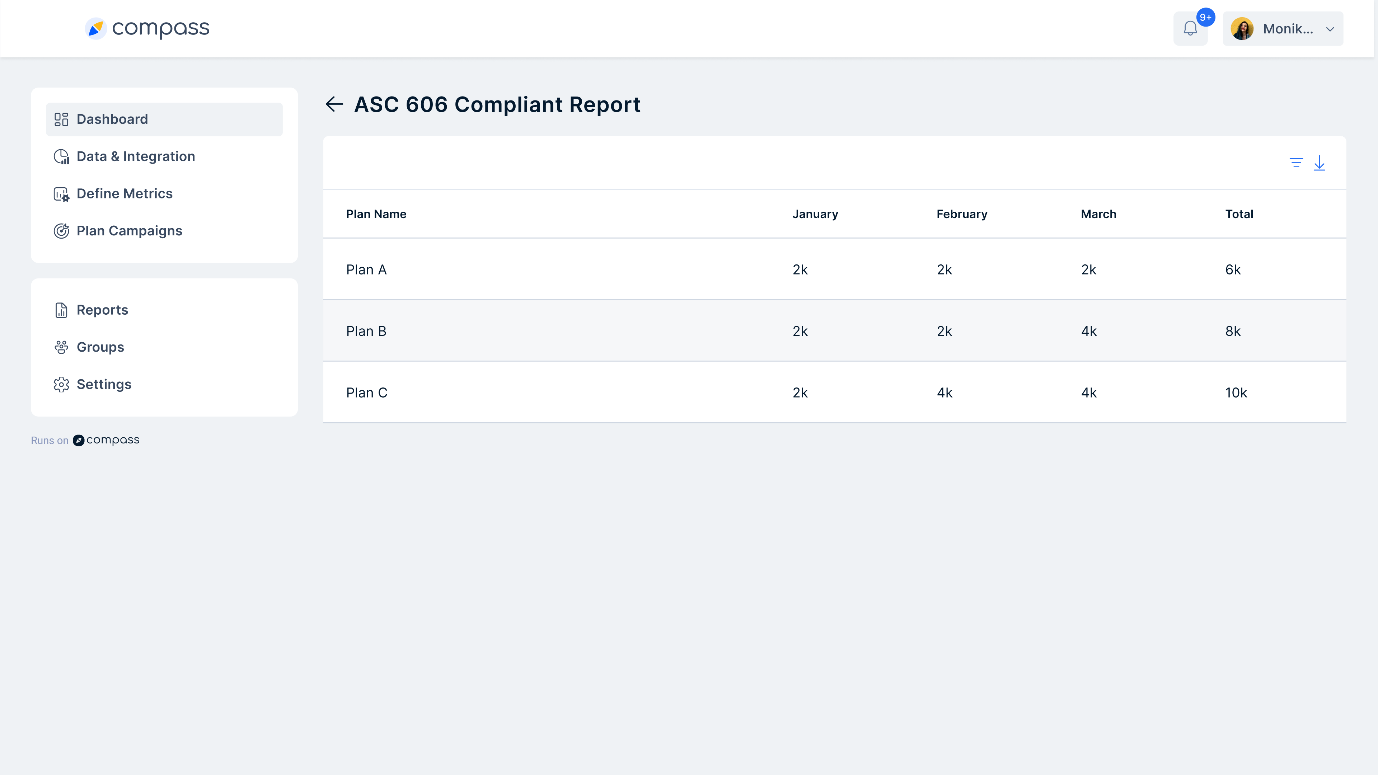
- Compilação ASC 606: Garante que todos os planos de comissões e incentivos estão em conformidade com regulamentos como o ASC 606 e o IFRS 15, uma caraterística essencial do Compass.
Ideal para: Líderes de vendas e equipas financeiras que gerem estruturas de comissões.
Quando utilizar: Útil para analisar tendências de compensação e efetuar ajustes nos planos de comissões com o Compass.
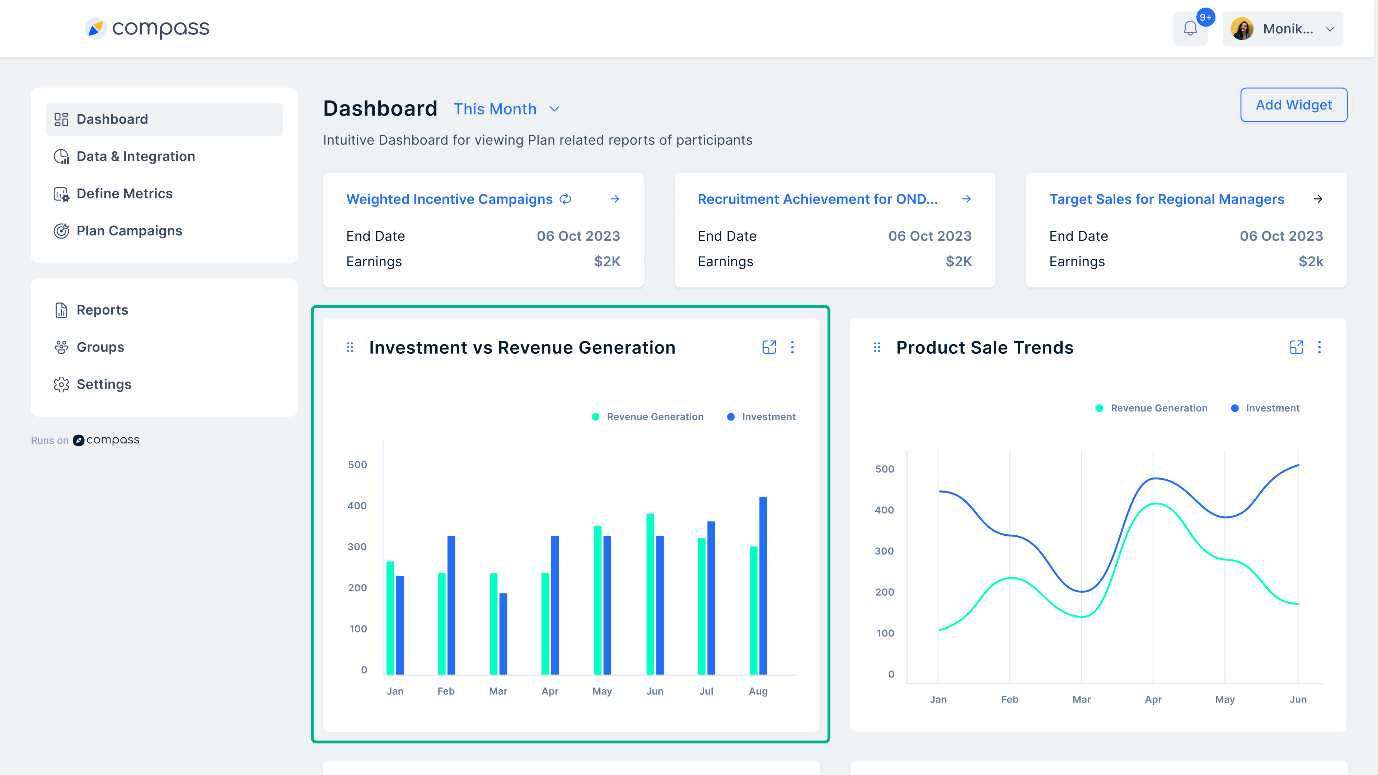
3. Painel de controlo do Sales 360
Um painel de vendas 360 oferece uma visão completa das tendências de vendas, classificações de líderes e cálculos de ROI. Compass fornece estas informações para ajudar as empresas a compreender os padrões de vendas de produtos e o desempenho dos utilizadores.
Widgets principais:
- Tendências de vendas de produtos: Monitoriza as alterações nas vendas de produtos ao longo do tempo. Ajuda as empresas a identificar os produtos que são populares e os que necessitam de mais atenção.
- Tabela de classificação: Classifica os representantes de vendas com base em métricas de desempenho, como receitas e volume de vendas. Compass utiliza tabelas de classificação para promover um ambiente de vendas competitivo e motivado.
- Métrica versus planos: Fornece informações sobre o desempenho de diferentes planos de vendas em comparação uns com os outros. Os administradores podem personalizá-lo para acompanhar os principais indicadores de desempenho (KPIs) utilizando Compass.
Ideal para: Gestores de vendas e executivos que procuram uma visão completa das actividades de vendas.
Quando utilizar: Útil para comparar estratégias de vendas, monitorizar o desempenho dos representantes de vendas e definir objectivos futuros com o Compass.
4. Painel de controlo das comissões de vendas
Um painel de comissões de vendas monitoriza os ganhos, o desempenho dos utilizadores e as conquistas de quotas. Ajuda os administradores a gerir os pagamentos e a garantir uma compensação justa através das funcionalidades de controlo automático do Compass.
Widgets principais:
- Visão geral dos ganhos: Apresenta o total de ganhos, aprovações pendentes e pagamentos rejeitados.
- Relatório de desempenho: Mostra um instantâneo do desempenho do utilizador em diferentes planos de vendas. Pode ser personalizado para filtrar utilizadores ou planos específicos.
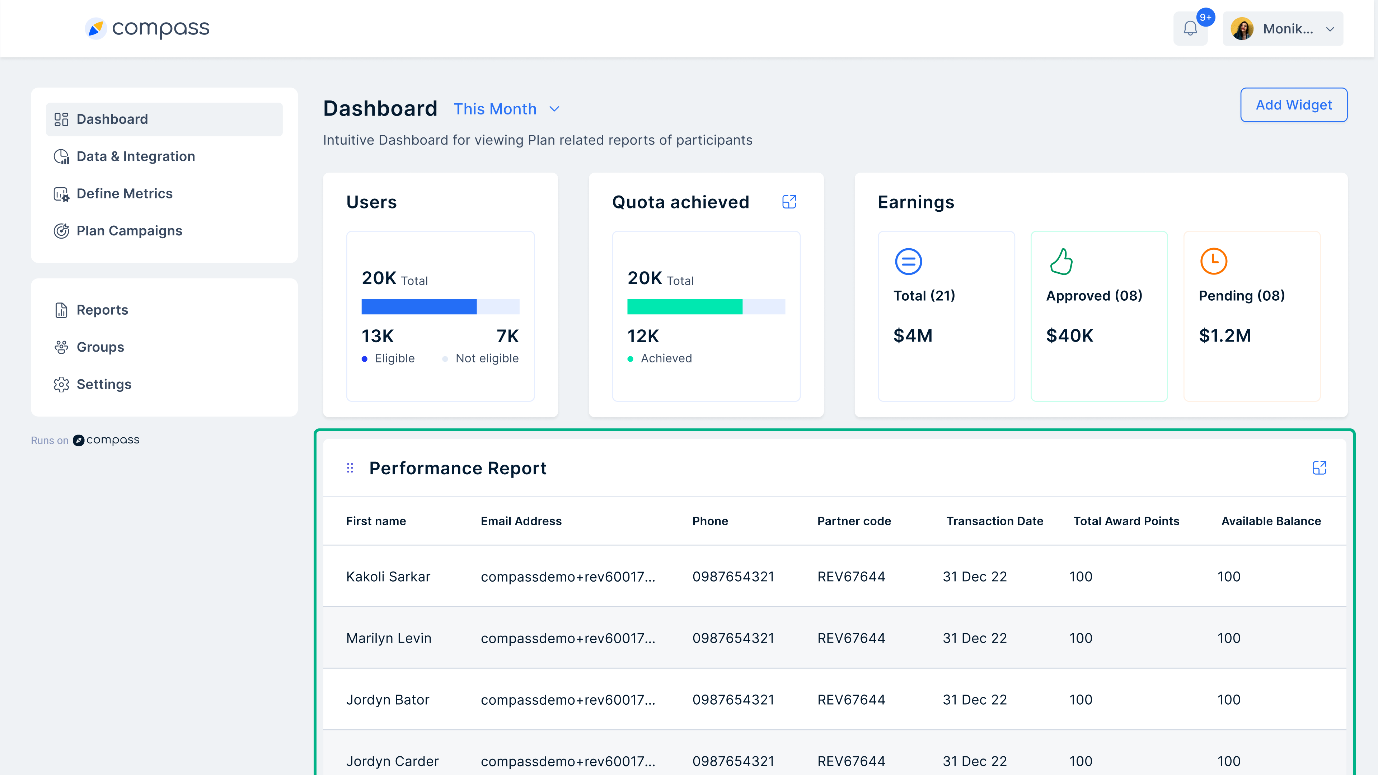
- Utilizadores e quotas: Destaca os utilizadores que atingiram as suas quotas e os que ainda estão a trabalhar para as atingir.
Ideal para: Líderes de vendas e equipas financeiras responsáveis pelo pagamento de comissões.
Quando utilizar: Essencial para acompanhar e ajustar as estruturas de comissões com base no desempenho das vendas com o Compass.
Porque é que precisamos de um software de painel de vendas?
De acordo com aHubSpotaté 78% dos vendedores consideram que o seu CRM é eficaz para melhorar o alinhamento das vendas. No entanto, para maximizar o efeito, implemente um software de painel de vendas. Não só centralizará e organizará visualmente os dados críticos de vendas, como também eliminará a necessidade de compilar informações de várias fontes. Imagine a quantidade de tempo e esforço que pode poupar e que pode ser utilizado em tarefas administrativas. O painel de controlo permite-lhe:
- Acompanhe as principais métricas e KPIs:O software de painel de vendas permite que as empresas monitorizem todos os indicadores de desempenho essenciais (KPI) e métricas-chave (por exemplo, taxas de conversão, geração de leads, estado do pipeline de vendas) num único local. Esta visão abrangente permite uma tomada de decisões informada e ajuda a identificar áreas que requerem melhorias.
- Acompanhamento do desempenho das equipas:Pode personalizar o painel de controlo analítico de vendas de acordo com a sua necessidade de acompanhar o desempenho de equipas individuais e de representantes de vendas. Isto permite que os gestores identifiquem os melhores desempenhos, reconheçam as áreas em que é necessária formação adicional e garantam que todos estão alinhados com os objectivos gerais de vendas.
- Monitorização de comissões e incentivos:O software do painel de controlo de vendas pode ser configurado para apresentar as estruturas de comissões, o progresso das campanhas de incentivos e os ganhos individuais dos representantes de vendas. Esta transparência motiva as equipas e promove uma cultura de vendas orientada para os resultados.
Ao fornecer uma visualização de dados e informações em tempo real, o software de painel de vendas permite que as empresas optimizem os seus esforços de vendas e alcancem um crescimento sustentável.
Como utilizar o software de painel de controlo de vendas para obter os melhores resultados?
Aestudo da Salesforceindica que as estratégias baseadas em dados são um fator-chave para o sucesso, com 79% das equipas de vendas com elevado desempenho a utilizarem esta abordagem. Dada a natureza convincente destes dados, é evidente que os vendedores necessitam de um enquadramento estratégico para obterem os melhores resultados.
- Identificar indicadores-chave de desempenho(KPIs): Determine as métricas críticas que reflectem o sucesso da sua equipa de vendas. Os exemplos incluem receitas geradas, taxas de conversão e duração do ciclo de vendas.
- Selecionar um software de painel de vendas: Escolha um software que se integre nas suas fontes de dados existentes, como o seu sistema CRM, e que ofereça visualizações que correspondam às suas necessidades.
- Crie o seu painel de controlo: Conceba um painel de controlo claro e conciso que apresente os KPIs escolhidos. Dê prioridade às métricas mais importantes para facilitar a visibilidade.
- Monitorizar o desempenho regularmente:Programe revisões regulares do seu painel de controlo analítico de vendas para acompanhar o progresso em relação aos objectivos e identificar áreas a melhorar.
- Tomar medidas acionáveis:Com base nas informações do painel de controlo, faça ajustes orientados por dados às suas estratégias e tácticas de vendas.
Aspectos a ter em conta ao escolher o melhor software de painel de controlo
Um estudo efectuado pelaMcKinsey & Companyem 2022 concluiu que a utilização extensiva de dados nas estratégias de vendas B2B pode levar a um crescimento das vendas até 25%. No entanto, selecionar o software de painel de controlo de vendas mais adequado pode ser uma tarefa difícil, uma vez que existe uma grande variedade de ferramentas disponíveis, cada uma das quais responde às necessidades específicas de diferentes modelos de negócio. Eis alguns factores-chave a considerar ao selecionar o software de painel de controlo mais adequado às suas necessidades:
1. Compatibilidade da fonte de dados: Certifique-se de que o software pode ligar-se às suas fontes de dados existentes, como bases de dados ou plataformas de marketing.
2. Personalização:A capacidade de adaptar os painéis de controlo às suas necessidades específicas e de apresentar as métricas mais relevantes é crucial.
3. Visualização de dados:Procure um software que ofereça uma variedade de opções de visualização claras e fáceis de compreender, como quadros e gráficos.
4. Escalabilidade:Pense se o software pode acomodar o seu crescente volume de dados e necessidades futuras.
5. Segurança:O software deve dar prioridade à segurança dos dados para proteger as informações sensíveis.
Estudos de caso: A Mahindra Finance vê a gestão de incentivos 40% mais rápida com o painel de controlo Compass
A Mahindra Finance é uma importante empresa financeira não bancária do Grupo Mahindra, uma empresa indiana líder. A empresa especializa-se na oferta de serviços financeiros, tais como empréstimos para veículos, empréstimos para habitação, empréstimos pessoais e seguros.
A Mahindra Finance emprega mais de 20.000 representantes de vendas em todo o país, e estes representantes de vendas, que constituem as equipas de vendas diretas, desempenham um papel essencial nas realizações da empresa. No entanto, a gestão das suas comissões e estruturas de incentivos apresentava dificuldades significativas. Este facto resultou num descontentamento generalizado e em ineficiências operacionais.
Em que é que a Mahindra Finance precisava de ajuda?
A Mahindra Finance estava insatisfeita e notou ineficiências entre os funcionários. Tinham um sistema de dados fragmentado. Os dados de vendas estavam dispersos por várias plataformas. Isso causava problemas de recuperação, ineficiência e perda frequente de dados.
A combinação de dados provenientes de várias fontes revelou-se complexa e suscetível de erros. Consequentemente, atrasava os cálculos dos incentivos. A empresa tinha vários planos de incentivos adaptados a diferentes regiões que exigiam actualizações frequentes e ajustamentos manuais. Este processo aumentava o risco de erros.
Para além disso, os demorados recálculos devido a compensações de cheques e requisitos de auditoria eram propensos a erros e faltava transparência para os funcionários, o que atrasava o pagamento dos incentivos. Para ultrapassar os desafios, procuraram a ajuda da Compass, um software de gestão de incentivos de vendas, para simplificar as complexidades.
Que medidas adoptou Compass para ajudar a Mahinda Finance?
Compass planeou e executou cuidadosamente vários processos de implementação. Compass integrou o seu painel de controlo reativo para consolidar todas as fontes de dados numa plataforma única e central. Isto ajudou-os a eliminar a necessidade de gerir dados de várias localizações. Automatizaram o processamento de dados para aumentar a velocidade e a precisão.
Para além disso, permitiram à Mahinda Finance efetuar cálculos em tempo real para garantir que os cálculos são feitos com base em regras e programas pré-determinados e que os representantes de vendas são pagos prontamente e com precisão.
Compass ofereceu à Mahindra Finance flexibilidade suficiente para atualizar e gerir facilmente vários programas de incentivos em diferentes regiões e linhas de produtos. O que provou ser benéfico foi a adição do painel de controlo, uma vez que permitiu aos representantes de vendas acompanhar o seu desempenho e os cálculos de incentivos em tempo real. Isto promoveu a confiança e melhorou a comunicação.
De que alterações se apercebeu a Mahindra Finance?
Compass automatizou o processo de comissões de vendas. Como resultado, a Mahindra Finance notou,
- O número de representantes que se qualificaram para os incentivos aumentou mais de 25%.
- Os erros de cálculo foram minimizados em mais de 98%.
- A velocidade de processamento de incentivos melhorou em mais de 99%.
- Aumento de 30% no desempenho das vendas.
- Redução de 40% do tempo dedicado à gestão dos incentivos.
Conclusão
Obtenha uma visão clara e centralizada dos dados de vendas cruciais utilizando o software de painel de controlo de vendas. Monitorizar o desempenho, identificar tendências e tomar decisões informadas para atingir os nossos objectivos de vendas. Embora existam muitas opções, recomendamos Compass. Com oCompassé possível:
- Acompanhe o desempenho das vendas e os pagamentos em tempo real.
- Aceda a análises e informações avançadas, adicionando filtros e identificando tendências por região, equipas e programas em tempo real.
- Gerar declarações sem erros a um nível granular.
- Obtenha aspectos de visibilidade das comissões, incluindo negócios em preparação, comissões acumuladas, previsões e muito mais.
Facilite a análise e a otimização das estratégias de vendas com o Compass. Agende uma chamada de demonstração agora para saber como os nossos especialistas podem fornecer uma visão centralizada das métricas de vendas críticas e estabelecer a prática da tomada de decisões orientada por dados para si.
FAQs
Como posso criar um painel de desempenho de vendas no Excel?
Para criar um painel de desempenho de vendas no Excel:
- Recolha de dados: Recolher dados de vendas das suas fontes.
- Organizar os dados: Estruturar os dados num formato claro e lógico.
- Inserir tabelas e gráficos: Utilizar as ferramentas de gráficos do Excel para criar visualizações.
- Utilizar tabelas dinâmicas: Resumir e analisar dados com tabelas dinâmicas.
- Conceber a apresentação: Organizar os gráficos e tabelas para facilitar a visualização.
- Adicionar interatividade: Utilize separadores e filtros para tornar o painel interativo.
- Rever e atualizar: Atualizar regularmente os dados e aperfeiçoar o painel de controlo.
O que está incluído num painel de controlo?
Um painel de controlo inclui normalmente:
- Principais métricas e KPIs: Os pontos de dados mais importantes a seguir.
- Visualizações: Quadros, gráficos e tabelas para representar dados.
- Filtros e controlos: Opções para personalizar a vista e aprofundar os dados.
- Fontes de dados: Informação sobre a proveniência dos dados.
- Informação contextual: Anotações ou explicações para fornecer contexto.
O que é um painel de controlo de KPI?
Um painel de controlo KPI (Key Performance Indicator) é uma ferramenta que visualiza as métricas e os KPI mais importantes para uma empresa. Ajuda a monitorizar o desempenho em relação aos objectivos e a tomar decisões baseadas em dados.
Quais são os três tipos de painéis de controlo?
Os três tipos de painéis de controlo são:
- Painéis de controlo operacionais: Monitorizar processos e operações em tempo real.
- Painéis de controlo analíticos: Analisar grandes volumes de dados para identificar tendências e percepções.
- Painéis de controlo estratégicos: Acompanhe as estratégias e objectivos da empresa a longo prazo.
Como criar um painel de controlo de vendas?
Para criar um painel de vendas, siga estes passos:
- Defina os seus objectivos: Determine o que pretende alcançar com o painel de controlo.
- Identificar os principais indicadores: Escolha os indicadores de vendas mais importantes a seguir.
- Recolher dados: Recolha dados das suas ferramentas de vendas e bases de dados.
- Escolha uma ferramenta de dashboard: Selecione uma ferramenta como o Excel, Tableau ou Power BI.
- Conceber o esquema: Organize o painel de controlo para facilitar a leitura.
- Visualizar dados: Utilizar quadros, gráficos e tabelas para representar dados.
- Rever e aperfeiçoar: Atualizar e melhorar continuamente o painel de controlo.